This guide gives you a quick tour of the Tugger interface so you know where to find everything.
My Connectors (home screen)
When you log in to Tugger, you'll land on the My Connectors page. This is your home screen and shows all the connectors you've set up.
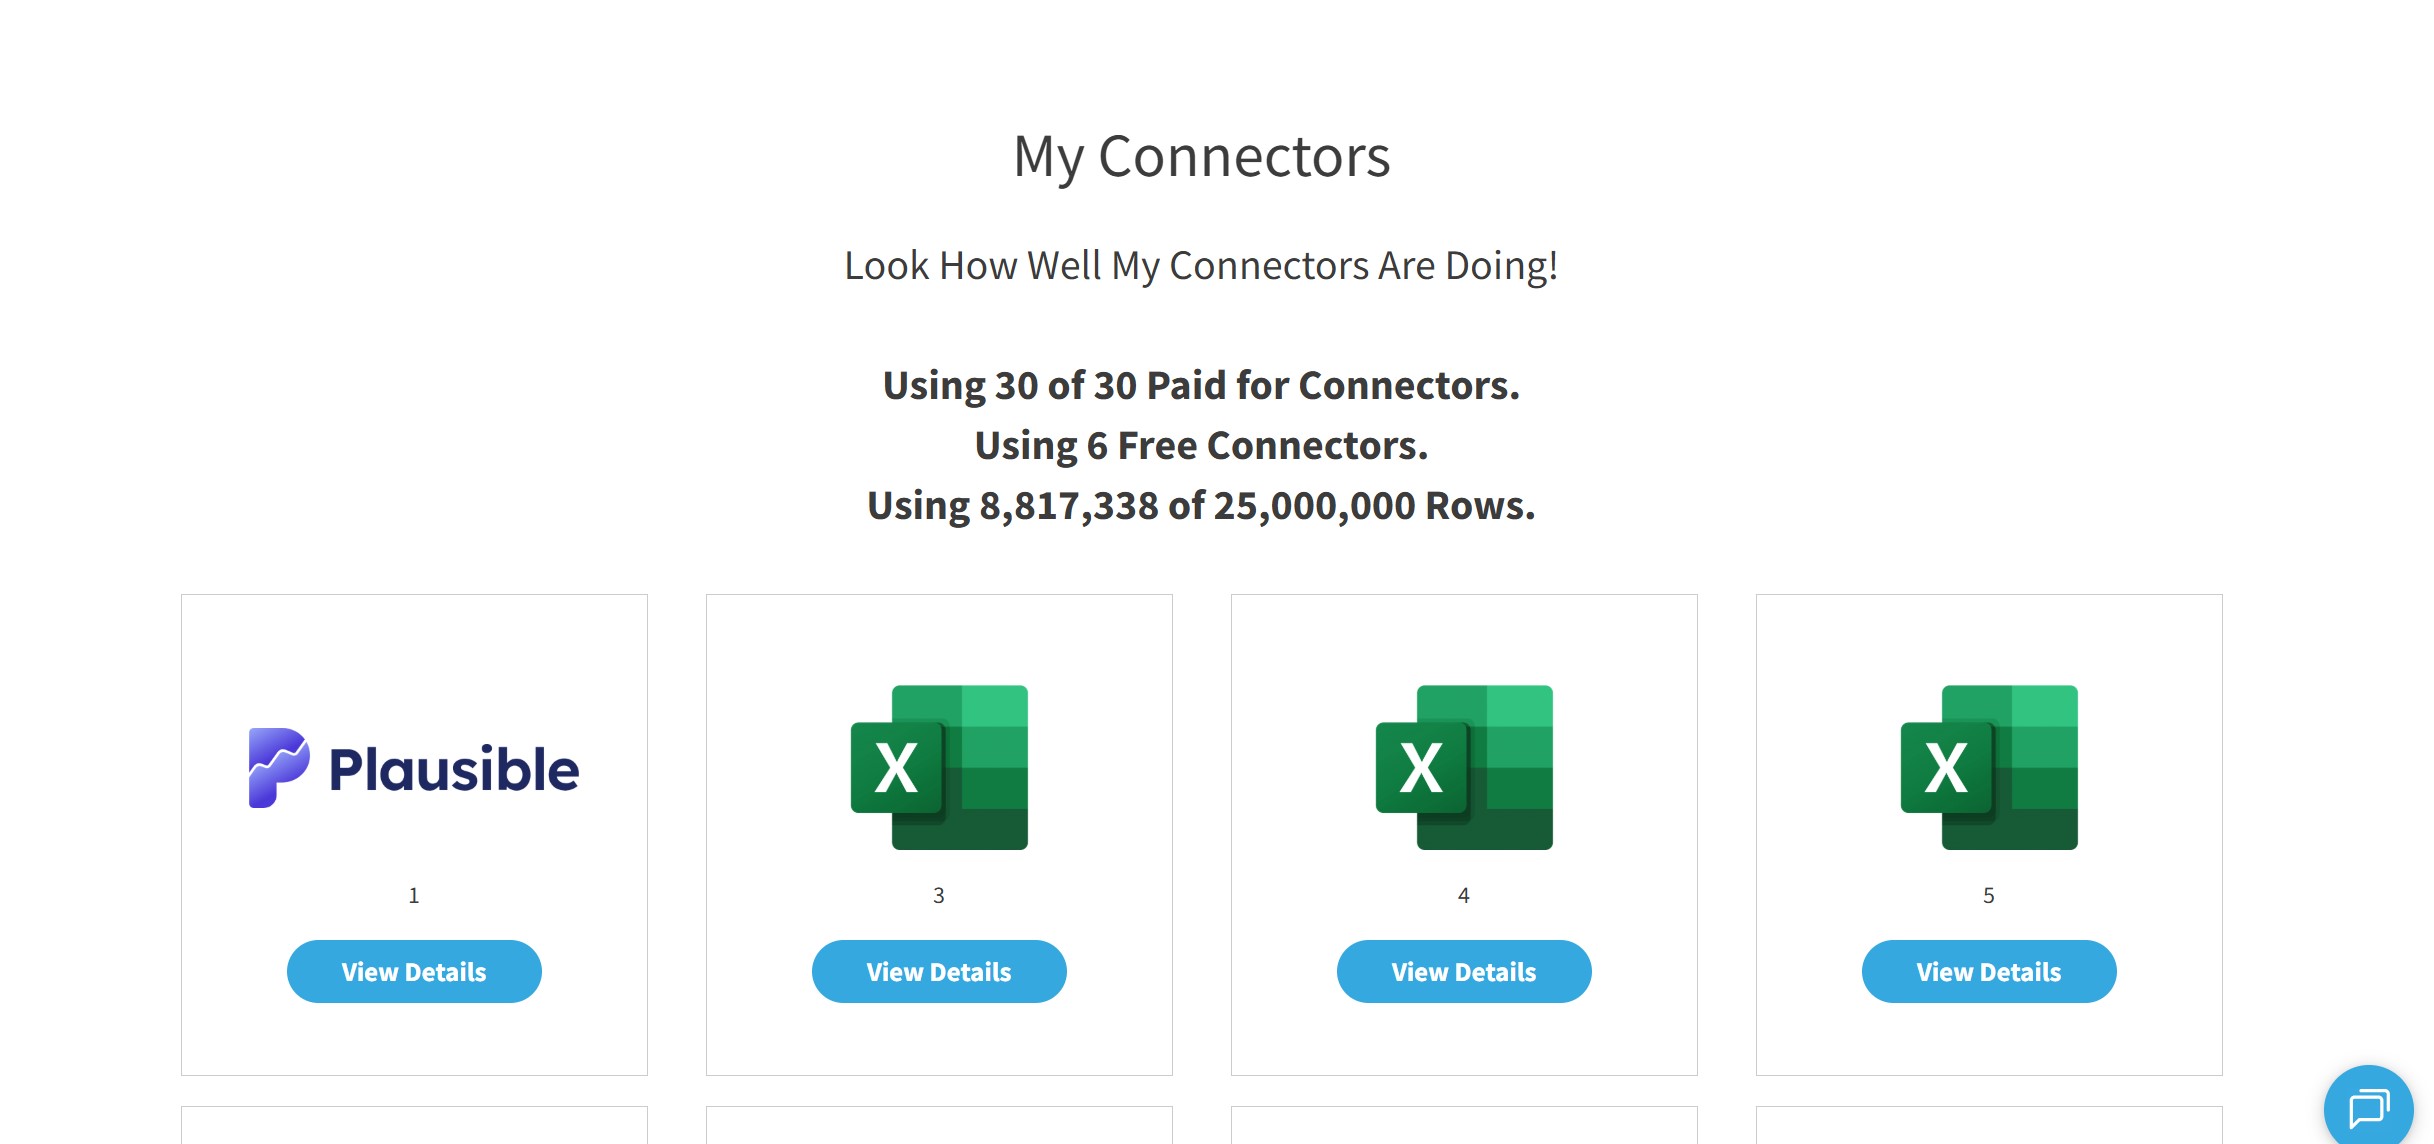
At the top of the page you'll see a summary of your account usage:
- Paid Connectors - how many of your plan's connectors you're currently using
- Free Connectors - any additional free connectors on your account
- Rows - how much of your data storage is in use
Below that, each connector is shown as a card. Click on a connector card to open it and access its settings, sync schedule, and report setup.
If you haven't set up a connector yet, you'll be taken straight to the Add Connector page instead.
Main navigation
The navigation bar along the top of the screen gives you access to everything in Tugger.

My Connectors - returns you to the home screen showing all your connectors.
Add Connector - start the setup process for a new connector. See Setting Up Your First Connector.
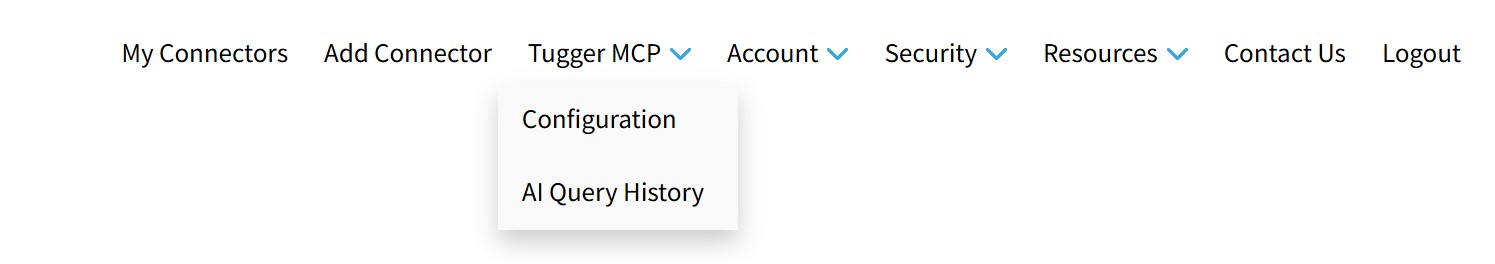
Tugger MCP - manage your AI Insights connections:
- Configuration - set up and manage your MCP server URL, OAuth access, and control which connectors each user can access through AI platforms. See Tugger MCP Configuration.
- AI Query History - view a log of AI queries made against your data.
Account - manage your account settings and subscription.
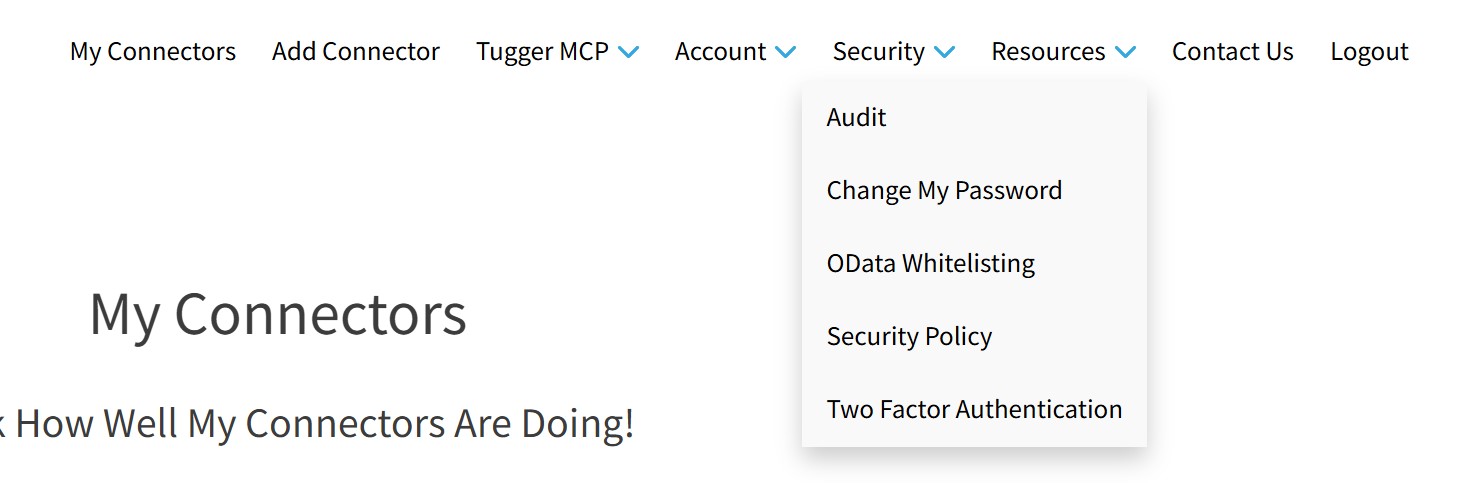
Security - access security-related settings:
- Audit - view an audit log of activity on your account
- Change My Password - update your Tugger password
- OData Whitelisting - restrict which IP addresses can access your OData feeds
- Security Policy - view your account's security policy settings
- Two Factor Authentication - enable or manage two-factor authentication for your Tugger login
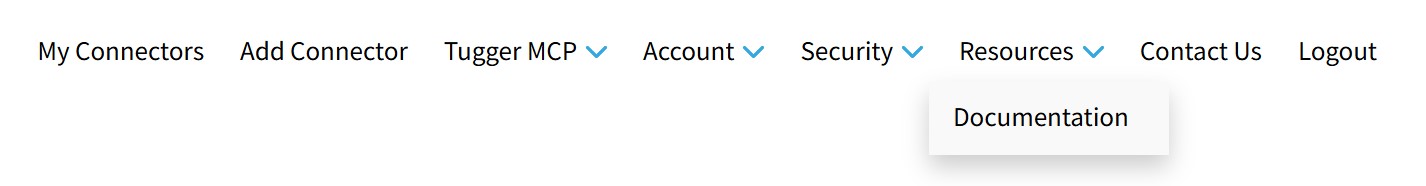
Resources - links to documentation and other resources.
Contact Us - get in touch with the Tugger team.
Logout - sign out of your account.
Your Support Pin Number is shown in the top-right corner. If you ever need to contact Tugger support, have this number ready as it helps us find your account quickly.
Connector pages
When you click on a connector from the My Connectors screen, you'll see a second navigation bar with tabs specific to that connector:
![[Screenshot: Connector-level menu showing Summary | Settings | Tug Schedule | Report Setup | Report Credentials]](https://cdn.document360.io/915cfc9e-45d4-4924-af8d-4cea920ef985/Images/Documentation/connector-menu.jpg)
Summary - shows the current status of your connector, including when the last sync ran and whether it completed successfully. You can also trigger a manual sync from here.
Settings - view and update your connector's configuration, including the connector name and data start date.
Tug Schedule - control when and how often Tugger syncs your data. See Managing Your Sync Schedule.
Report Setup - find your report templates (if available for your connector) and choose your reporting tool (Power BI, Tableau, Excel). See Connecting Power BI Desktop to Tugger.
Report Credentials - find the OData URL, Username, and Password needed to connect your reporting tool to Tugger. You can also regenerate your credentials from here. See Regenerating Report Credentials.
What's next?
- Setting Up Your First Connector - add your first connector
- Connecting Power BI Desktop to Tugger - start building reports
- What is Tugger AI Insights? - ask questions about your data using AI
Related articles: